The book includes the following:
? Try and practice new Excel 2022 Charts and Reports in your Excel 2019, Excel 2021 and Office 365 editions.
? Learn with easy-to-read, step-by-step instructions and screenshots.
? Learn to illustrate your data in a way that is readily digestible at a glance.
? Master PivotTables and PivotCharts to construct dynamic dashboards.
? Figure out how to make beautiful infographics that reflect your company's personality or culture.
? Learn the ins and outs of making and editing expert PivotTables and PivotCharts.
? Create Sensitivity-Analysis tables to check the quality of your decision-making tools.
? Utilize Excel's What-If analysis to check your assumptions and theories. Relevant Links: 108 Pearls Of Wisdom Books Online, White Books Online, Rural Extension Handbook Hb Books Online, My First Book Of Shapes Formes My First English French Board Book Books Online, Ead Economics 12 Books Online, Educative Jatak Tales Books Online, Navrang Saral Hindi Pathyapustakmala Abhyas Pustika 7 Books Online, Andy And His Accordion Books Online, Harry Potter And The Prisoner Of Azkaban Hufflepuff Edition 1 Books Online 9789355512475-
- Home
- Computer Technology
- Operating Systems
- Excel 2022 Pro 100+ Pivottables, Charts & Reports?
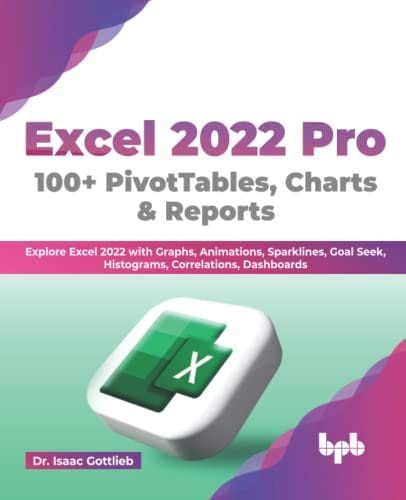
Excel 2022 Pro 100+ Pivottables, Charts & Reports?
Author: Dr. Isaac Gottlieb
Brand: BPB Publications
| VARIANT | SELLER | PRICE | QUANTITY |
|---|
Description of product
The book includes the following:
? Try and practice new Excel 2022 Charts and Reports in your Excel 2019, Excel 2021 and Office 365 editions.
? Learn with easy-to-read, step-by-step instructions and screenshots.
? Learn to illustrate your data in a way that is readily digestible at a glance.
? Master PivotTables and PivotCharts to construct dynamic dashboards.
? Figure out how to make beautiful infographics that reflect your company's personality or culture.
? Learn the ins and outs of making and editing expert PivotTables and PivotCharts.
? Create Sensitivity-Analysis tables to check the quality of your decision-making tools.
? Utilize Excel's What-If analysis to check your assumptions and theories. Relevant Links: 108 Pearls Of Wisdom Books Online, White Books Online, Rural Extension Handbook Hb Books Online, My First Book Of Shapes Formes My First English French Board Book Books Online, Ead Economics 12 Books Online, Educative Jatak Tales Books Online, Navrang Saral Hindi Pathyapustakmala Abhyas Pustika 7 Books Online, Andy And His Accordion Books Online, Harry Potter And The Prisoner Of Azkaban Hufflepuff Edition 1 Books Online
Renting Guidelines
Specification of Products
| Brand | BPB Publications |
Related products
User reviews
INFORMATION
ADDRESS
Trubrain Education India Pvt Ltd"VV Square"building, Plot.No.TS 710/1b1 & 2B1, CMC Ward No 18, Moka road, Gandhinagar, Ballari-583 101.
Bellari
Karnataka - 583101
IN
Welcome to our online bookstore, the ultimate destination for book lovers, stationery enthusiasts, and curious minds of all ages. With our extensive selection of books, including bestsellers, new releases, and used books, as well as a range of stationary, toys, and reading accessories, we have everything you need to ignite your imagination and satisfy your curiosity.
Whether you're looking for an exciting sci-fi novel, an inspiring biography, or a fun activity book for your kids, our online bookstore has it all. We offer a wide variety of genres, including fiction, non-fiction, children's books, and educational books, so you're sure to find something that sparks your interest.
In addition to traditional books, we also offer e-books for those who prefer to read on their electronic devices. And if you're looking for a more sustainable option, our used books section offers pre-owned books in great condition, helping to reduce waste and save money.
To complement our extensive book selection, we also offer a range of high-quality stationery, including art supplies, pens and pencils, notebooks, and journals. Whether you're an aspiring artist, a student, or a professional, we have everything you need to unleash your creativity and get organized.
And for those who prefer to rent rather than purchase, our book rental service allows you to enjoy your favorite books for a limited time at an affordable price.
At our online bookstore, we're committed to providing our customers with the best possible shopping experience. Our user-friendly website makes it easy to find and purchase your favorite books and stationery items, and our fast and reliable shipping ensures that your products are delivered to your doorstep in no time.
So whether you're a seasoned reader, a curious learner, or a parent looking for educational resources for your kids, we invite you to explore our selection and discover a world of endless possibilities. Shop with us today and experience the joy of reading and learning.

